
Beef or Chicken: Which Meat Should You Choose?
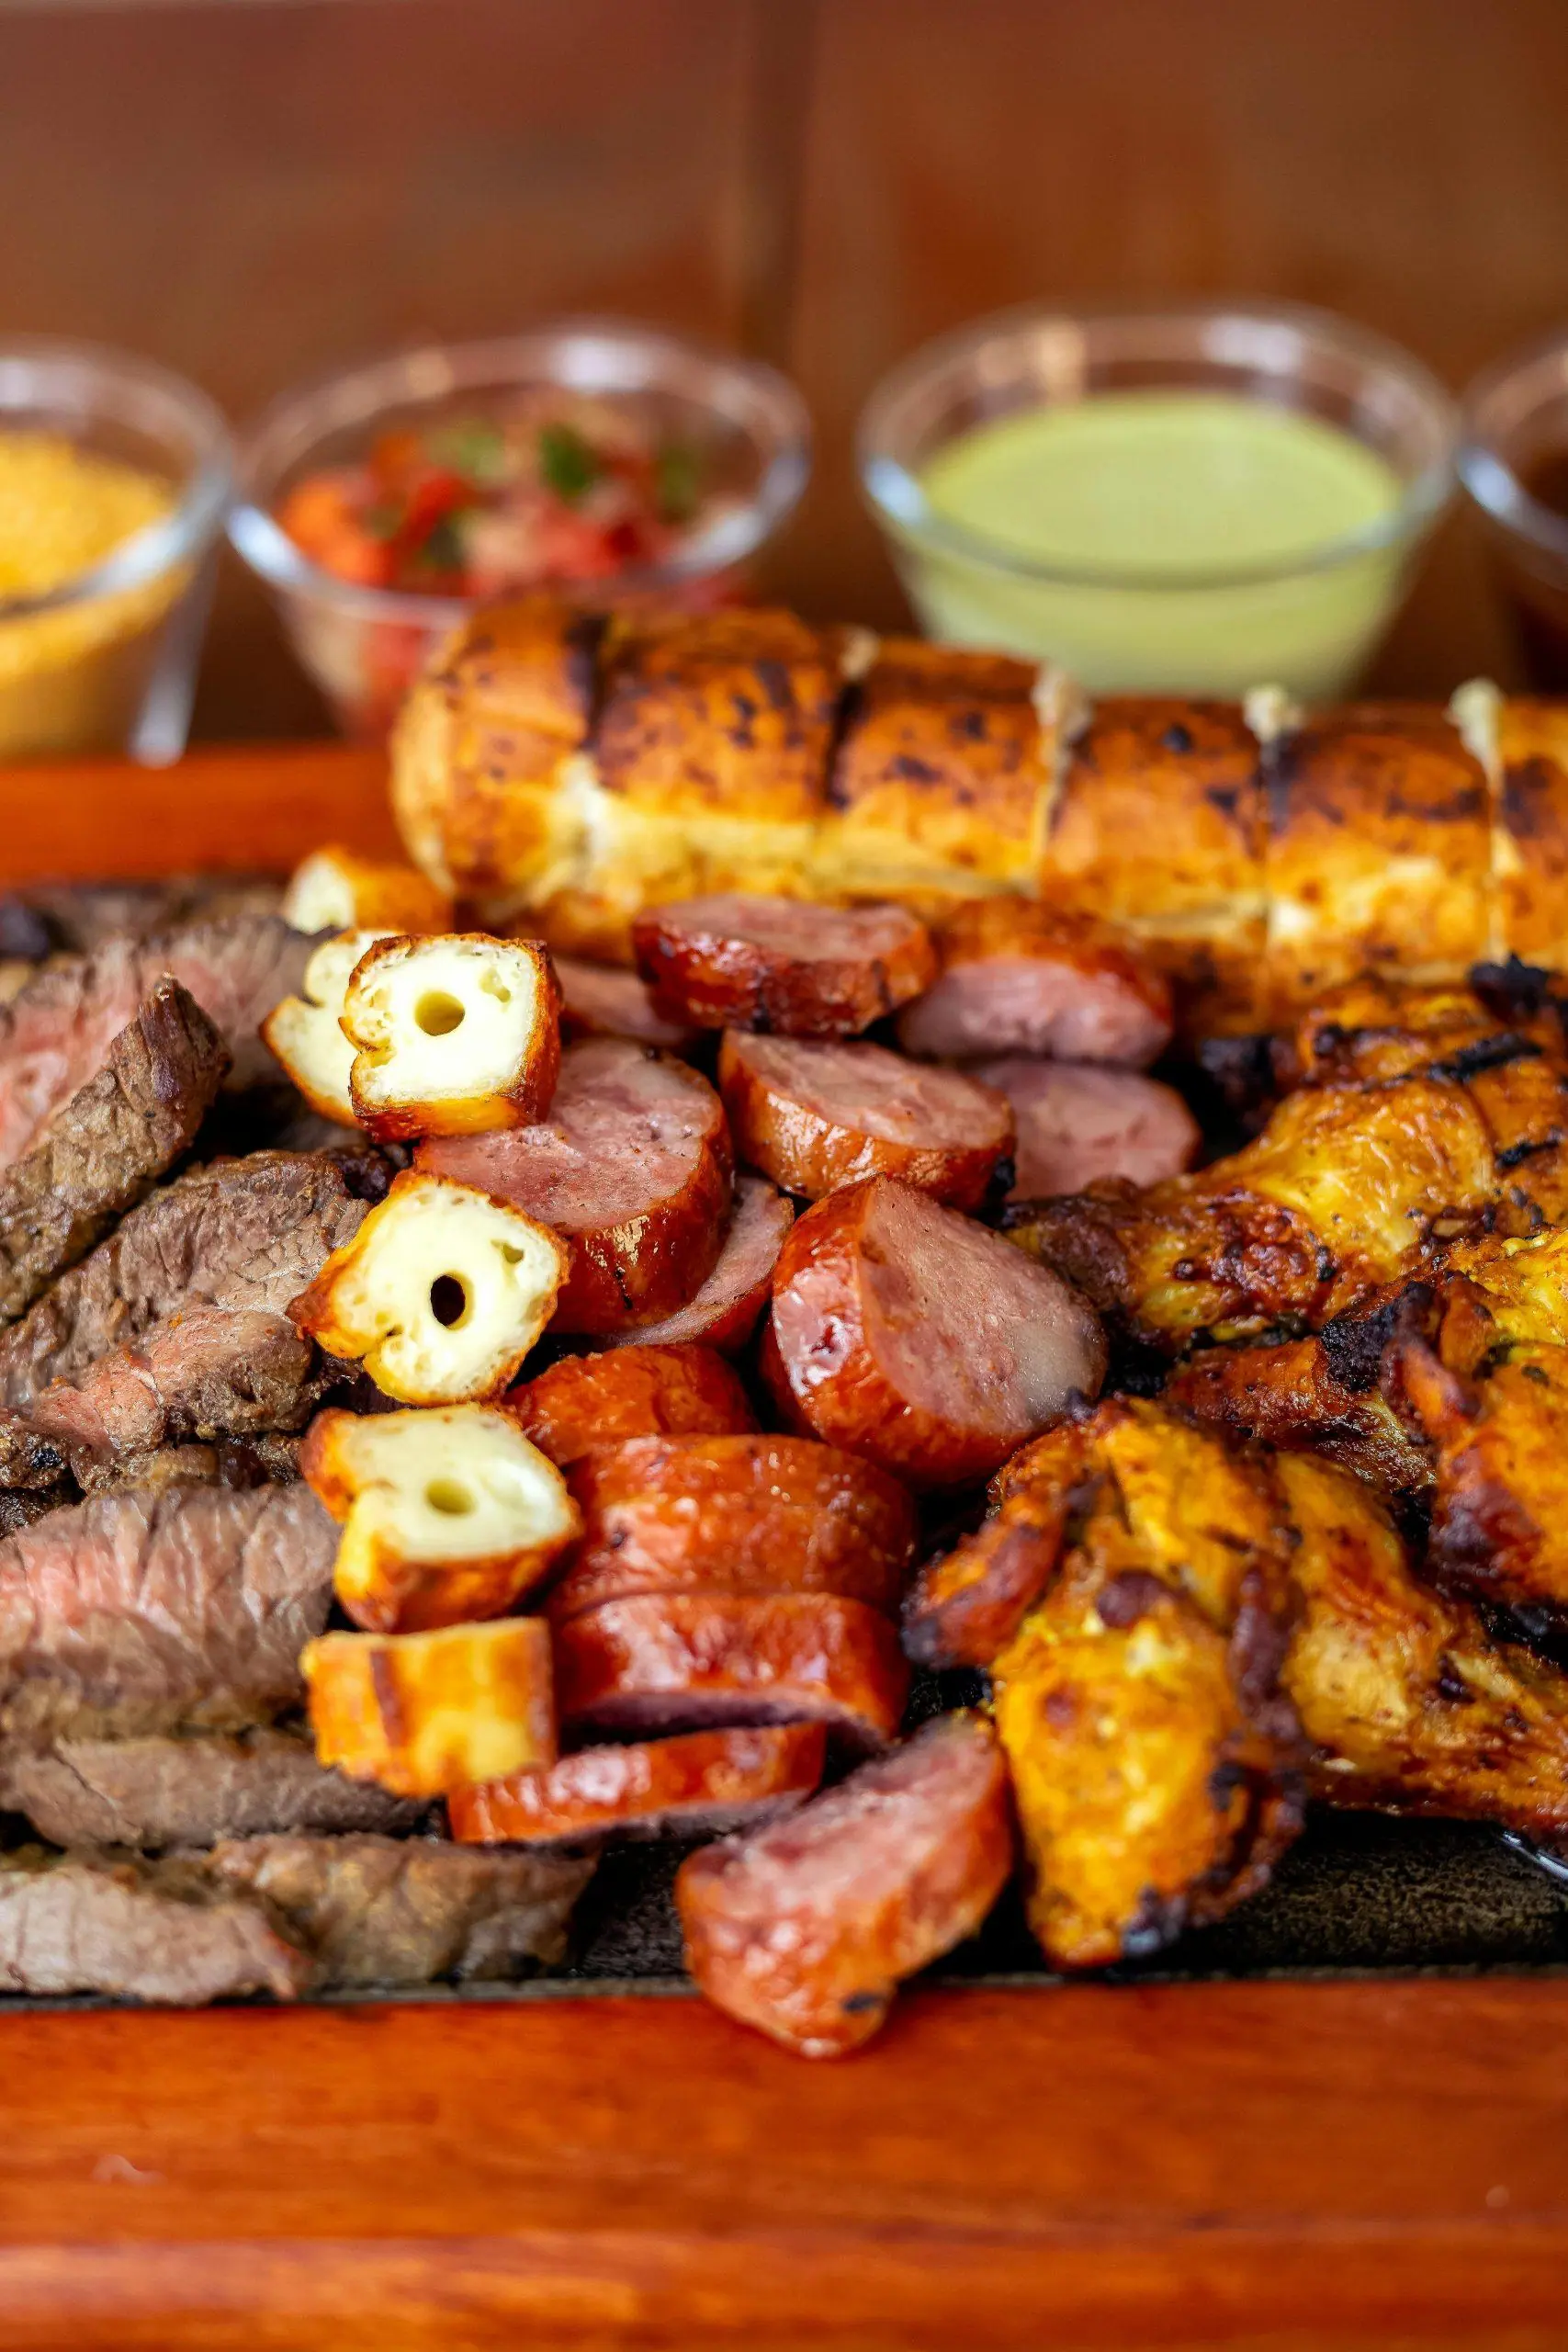
In brief: beef and chicken are both complete protein sources and, per 100 g of raw meat, contain a very similar amount of protein. Beef carries a richer amino acid profile and far more iron and zinc; chicken carries less fat, and much less saturated fat. The cut matters more than the species, and the sensible answer for most active people is not one or the other but poultry and fish as the base with red meat kept occasional.
Meat is the default protein of most diets, and among physically active people the choice between red and white meat is a recurring question. Is chicken simply the better protein? Should beef be dropped altogether? The comparison below works through the actual figures: energy and macronutrients, the amino acid profile, the mineral content, and what the evidence says about red meat.
Red meat and white meat: what separates them
Meat is classified by its fat content and by the amount of myoglobin and its derivatives in the muscle. That is the basis for the split into red meat, such as beef and pork, and white meat, such as chicken and turkey. White meat has long been regarded as the healthier choice because of its composition, but that does not mean the others should disappear from the plate.
Water is the dominant component of any meat, but meat remains an excellent protein source. The protein content depends on the species and, just as much, on the cut: shoulder does not have the same value as fillet. That in turn shapes the amino acid profile and the total nitrogen, both of which matter to anyone training to build muscle.
Energy and macronutrients per 100 g of raw meat
| Meat | Water (g) | Nitrogen (g) | Protein (g) | Fat (g) | Saturated fat (g) | Energy (kcal) |
|---|---|---|---|---|---|---|
| Beef | 69.3 | 3.4 | 21.4 | 7.5 | 3.28 | 152 |
| Veal | 71.4 | 3.3 | 21.0 | 6.0 | 2.59 | 137 |
| Pork | 67.8 | 3.3 | 20.4 | 10.0 | 3.91 | 174 |
| Chicken | 70.3 | 3.4 | 21.4 | 6.0 | 1.65 | 139 |
The figures are averages drawn from a range of studies. Different sources publish slightly different numbers, mainly because of differing analytical methods and the origin of the meat, so treat them as orders of magnitude rather than exact values for a particular product.
Two results stand out. Beef and chicken carry the same protein figure per 100 g of raw meat. Chicken carries the same total fat as veal but roughly half the saturated fat of beef, which is where the reputation of white meat comes from.
The cut matters more than the species
Averages hide large differences between cuts of the same animal. Per 100 g of raw meat:
- Beef fillet averages 23.2 g of protein, rib steak 21.2 g.
- Skinless chicken breast provides 24.6 g, chicken thigh only 19.7 g.
- Pork loin provides 22.9 g, pork belly only 17.9 g.
The spread within a species is wider than the spread between species, so a precise answer to which meat is the better protein source requires naming the cut. What is not in doubt is that all of them supply complete protein, which is why animal products are so prominent in the diets of athletes, particularly during a mass-gaining phase.
Cooking changes the picture too. Heat drives off water, which concentrates some components in the remaining mass while others are lost, so values for cooked meat are not comparable with the raw figures above.
Amino acid profile
Amino acids are what the body actually uses in anabolic processes, so the profile of a meat is often more informative than an obsessive focus on the total protein figure. Values below are grams per 100 g of raw meat.
| Amino acid (g) | Skinless chicken breast | Beef fillet steak | Pork shoulder | Veal fillet |
|---|---|---|---|---|
| Tryptophan | 0.18 | 0.14 | 0.20 | 0.20 |
| Threonine | 0.56 | 0.88 | 0.84 | 0.88 |
| Isoleucine | 0.60 | 1.01 | 0.92 | 0.99 |
| Leucine | 1.02 | 1.76 | 1.60 | 1.61 |
| Lysine | 0.99 | 1.87 | 1.74 | 1.66 |
| Methionine | 0.30 | 0.58 | 0.52 | 0.47 |
| Cysteine | 0.17 | 0.28 | 0.22 | 0.23 |
| Phenylalanine | 0.52 | 0.87 | 0.79 | 0.81 |
| Tyrosine | 0.33 | 0.70 | 0.71 | 0.64 |
| Valine | 0.66 | 1.10 | 0.98 | 1.12 |
| Arginine | 0.80 | 1.43 | 1.25 | 1.19 |
| Histidine | 0.43 | 0.71 | 0.81 | 0.73 |
| Alanine | 0.72 | 1.34 | 1.10 | 1.20 |
| Aspartic acid | 1.19 | 2.01 | 1.83 | 1.74 |
| Glutamic acid | 2.24 | 3.32 | 2.99 | 3.19 |
| Glycine | 0.63 | 1.35 | 0.84 | 1.04 |
| Proline | 0.67 | 1.05 | 0.76 | 0.84 |
| Serine | 0.54 | 0.87 | 0.81 | 0.76 |
Beef leads on almost every line. It is markedly higher in the branched-chain amino acids, in arginine and in glutamic acid; the only branched-chain value where it is slightly behind is valine, where veal fillet edges ahead. Individual cuts shift the picture, as they did in the macronutrient table, but averaged across cuts the advantage of beef is clear.
If beef leads on amino acids, why do dietitians recommend limiting red meat? The answer is its fat content, and specifically the saturated fraction, together with the points set out further down.
Minerals per 100 g of raw meat
| Meat | Sodium (mg) | Potassium (mg) | Calcium (mg) | Magnesium (mg) | Phosphorus (mg) | Iron (mg) | Zinc (mg) |
|---|---|---|---|---|---|---|---|
| Beef | 44.0 | 333 | 4.7 | 18.5 | 174 | 1.5 | 4.0 |
| Veal | 51.8 | 340 | 4.8 | 19.5 | 189 | 0.6 | 2.6 |
| Pork | 45.6 | 338 | 4.4 | 19.6 | 187 | 0.7 | 2.2 |
| Chicken | 52.2 | 318 | 4.6 | 23.4 | 200 | 0.4 | 0.7 |
No single meat wins here. Beef leads decisively on iron and zinc, by a wide margin in both cases. Chicken leads on magnesium and phosphorus. For anyone with a marginal iron or zinc status, and endurance athletes and menstruating women are the usual cases, that difference is the strongest argument for keeping red meat in the diet rather than removing it.
Why not eat too much red meat
The reservations about heavy red meat consumption, and particularly processed red meat, come from a substantial body of population research rather than from a single study. Homocysteine is one of the mechanisms cited: it is produced in the body from the metabolism of methionine, and animal protein is one of its sources. As the amino acid table shows, pork and beef carry appreciably more methionine than chicken.
Persistently elevated homocysteine, especially alongside a deficiency in B vitamins, is associated with reduced elasticity of vessel walls and with atherosclerotic deposition, and therefore with a raised cardiovascular risk. Add a high intake of saturated fat and raised cholesterol and the risk of myocardial infarction or stroke rises further. The World Health Organization, on the basis of research findings, also notes that frequent consumption of large quantities of red meat is associated with the development of cancer, in particular colorectal cancer, and with type 2 diabetes.
Reducing or removing red meat is generally associated with lower systemic inflammation, changes in gut microbiota composition, weight loss and a lower cardiovascular risk. It also has costs: a lower intake of certain vitamins and minerals, notably haem iron and zinc, and in practice a slower muscle recovery for people who do not replace those inputs elsewhere.
So is red meat worth keeping?
Yes, in moderation. Red meat has a high nutritional value: plenty of complete protein, and a valuable source of B vitamins, mainly B1, B2, PP and B12, along with zinc. Its iron is haem iron, which is far better absorbed than the non-haem iron of plant sources. It is also a source of creatine, which matters to strength athletes, although the quantities present in meat are not enough on their own to meet the raised requirement of a heavy training load.
It is not established that eating beef or pork directly causes cancer or a heart attack. The association in the research is with high habitual intake, particularly of processed meat, over long periods. Eating red meat occasionally, choosing leaner cuts and keeping the rest of the diet varied reduces the risk considerably. The French source article quantifies the problematic level as a daily intake figure that does not match the published guidance, so no threshold is repeated here: follow the national dietary guidance that applies in your country for the recommended weekly limit.
The workable rule is moderation and variety. A few portions of red meat a month, with fish and poultry taking the main share and plenty of vegetables, fruit and fibre alongside, delivers good nutritional value and a more varied diet at the same time.
Frequently asked questions
Which has more protein, beef or chicken?
Per 100 g of raw meat the average is the same at 21.4 g. The difference comes from the cut: skinless chicken breast reaches 24.6 g, beef fillet 23.2 g, chicken thigh only 19.7 g.
Which is better for building muscle?
Both supply complete protein. Beef has the stronger amino acid profile, particularly in branched-chain amino acids, and supplies creatine, iron and zinc. Chicken supplies the same protein with less saturated fat, which makes it easier to eat frequently.
Is white meat always the healthier option?
On saturated fat, yes. On iron, zinc and amino acid density, no. Which matters more depends on the rest of your diet and on your own iron and zinc status.
Does cooking change the protein content?
It changes the figures per 100 g. Heat drives off water, so the remaining mass is more concentrated in some components while others are lost. Raw and cooked values are not directly comparable.
Should athletes cut red meat entirely?
There is no nutritional reason to. The evidence concerns high habitual intake, not occasional consumption. Cutting it entirely means replacing the haem iron, the zinc and the B12 from elsewhere and monitoring that it works.
Nutrition is one input, training is the other
Diet decides what the body has to work with; the training stimulus decides what it does with it. For facilities equipping the training side of that equation, Light In Fitness supplies professional strength training machines and cardio equipment to gyms, clubs, hotels, campuses and public facilities. Tell us your floor area and your user profile and request a quotation.